Bitcoin had an extraordinary bout of bullish price action since the latter end of July. A price jump on July 27th brought BTC price above a key technical level which shifted sentiment in the market.
The market responded by continuing its ascent to a recent high of $12,500. Moreover, Bitcoin recorded its second-longest streak of price trading above $10,000.
However, the price crashed back below $10k during the week with a 15% price drop over two days. Price has since recovered back above the closely observed $10k point but price prospects remain uncertain as price fails to overcome a key technical level once again.
As this 2-day price drop is the most significant since the 42% fall in mid-March, we dedicate this VYSYN VENTURES release to analysing some potential drivers behind the crash. Furthermore, we assess current market conditions and how the outlook for future price prospects may be shaping up.
DeFi Dumps
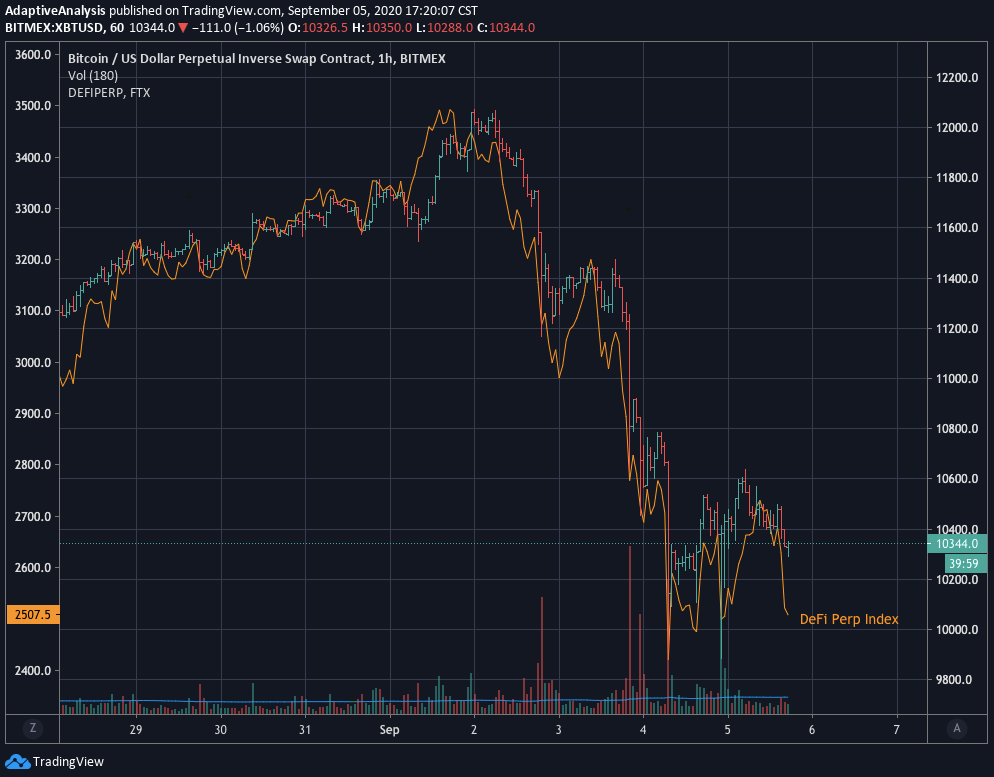
We previously highlighted that hype building behind Decentralized Finance (DeFi ) was likely a dominant driver behind altseason and the late-July Bitcoin price jump. The enormous returns experienced by DeFi speculators increased crypto investors appetite for risks and the bellwether of the crypto market Bitcoin benefitted. But on September 2nd, both declined simultaneously with the FTX DeFi perpetual index recording a drop of 29% over two days.

(Source: Tradingview.com)
Bitcoin declining is negative for DeFi. And DeFi declining is negative for Bitcoin in the short-term. Therefore, it can’t be ascertained that any one caused the other to drop. It is far more likely that a drop in one reinforced the decline in the other.
For instance, when the value of Bitcoin declines, the value of BTC collateral held in DeFi contractual agreements also diminishes. This will drive some to convert Bitcoin into USDT and use this as an alternative for collateral. This further spurs declining Bitcoin prices which will further pressurize DeFi speculators who hold their collateral in BTC-pegged assets.
Risk Assets Sell-Off

(Source: Tradingview.com)
A DeFi sell-off was not the only market drop which corresponded with the Bitcoin decline. On September 3rd, the S&P 500 recorded its largest one-day drop since June 11th.
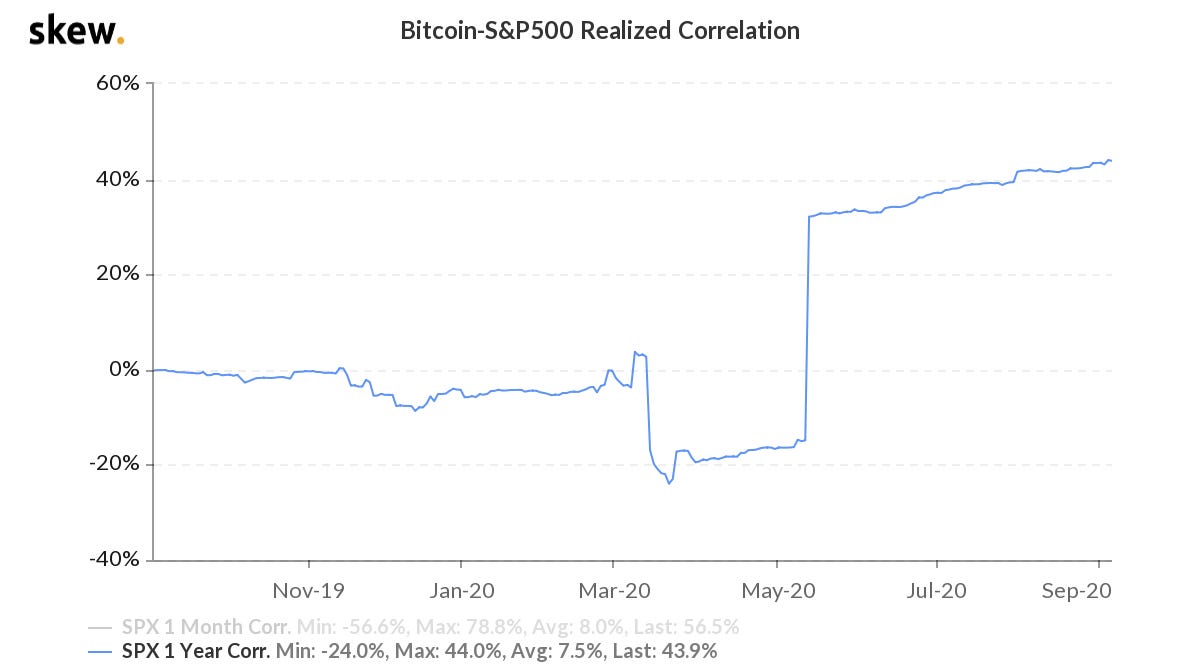
The fall in the S&P 500 took place roughly 24 hours after the drop in Bitcoin but highlights an increased correlation between the two this year. The 1-year correlation recently reached historically high values of 0.44.

(Source: Skew.com)
The higher correlation levels emerging between US equities and Bitcoin is likely the result of increased participation in the Bitcoin market from more sophisticated investors. We recently detailed how major purchasers of Bitcoin have been ramping up their buying activities. The likelihood of Bitcoin selling off in line with other risk-on assets increases as more sophisticated investors increase their exposure.
The presence of these big players in the Bitcoin market may have played a role in the September 2nd price drop. Such investors may have perceived that risk-on markets such as US equities were frothy and began transitioning to lower risk assets.
Head and Shoulders Pattern Precedes Price Drop

(Source: Tradingview.com)
It is also worth noting that a prominent reversal pattern formed before the Bitcoin price crash. The head and shoulders is the most widely acknowledged trend reversal technical indicator. While the pattern doesn’t guarantee a reversal, the odds of one occurring once this pattern forms are higher.
Despite several rises above $12k in August trading, Bitcoin only managed to record one daily close above this level during the month which was followed by a sharp sell-off below the following day. The combination of a right shoulder forming and seller liquidity being found above $12k were followed by the 15% September sell-off. While the sell-off was attributable to a combination of drivers, it may have been partially caused by bearish technicals forming.
September Price Prospects
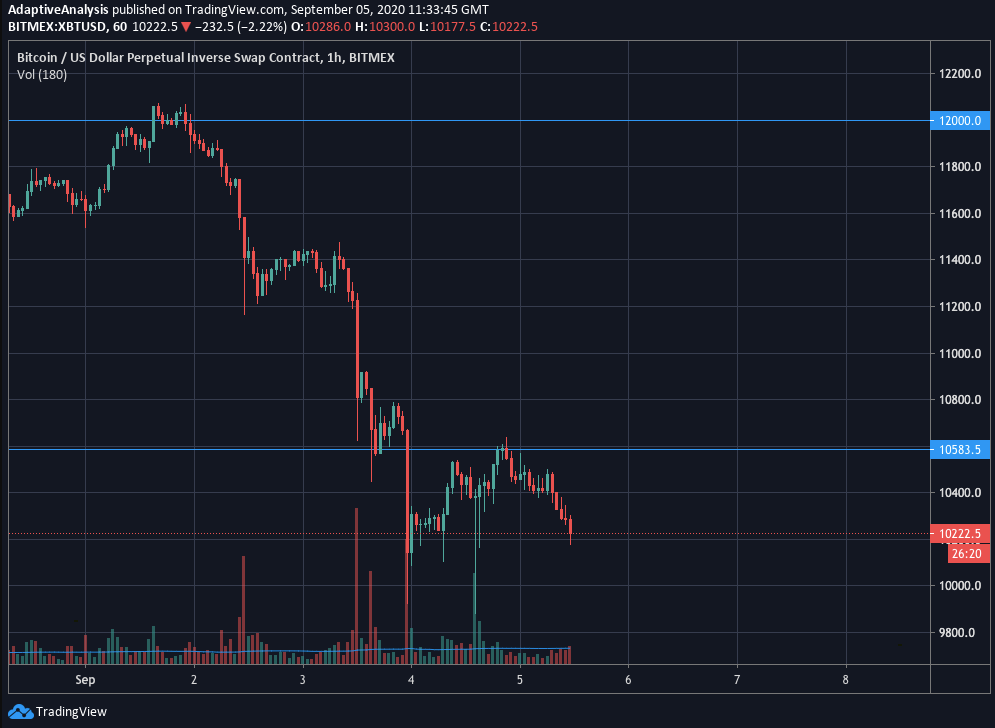
Bitcoin is once again trading below a key technical level at $10.5k. Overcoming this level was paramount for Bitcoin to show sustained price appreciation in August. Two retests of this level as support further highlighted its importance.
The September 3rd sell-off brought prices below this key point. Price has since retested the level as resistance but subsequently started selling-off.

(Source: Tradingview.com)
With price trading below this pivotal point, significant demand-side pressure will need to built to reclaim and hold valuations above this level. This increases the odds of further downside movement.
On the other side, pockets of buyer liquidity likely rest below $10k. However, the price has spent far more time trading in sub-$10k territory. This indicates that buyer liquidity sub-$10k may be easily overcome by selling pressure compared to the buying pressure required to surpass $10.5k again.
While the price could unfold in any direction, we currently see higher odds of a sell-off below $10k. In the meantime, ranging between $10k and $10.5k seems likely as the demand-side and supply-side adjust to the new market dynamics.
For daily updates on the most important crypto developments, stay tuned on the VYSYN Telegram channel and Twitter.


